Skip to content
As metioned the LiDAR Measurement System , In automated logistics scenarios, the precise identification and real-time positioning of cargo on trucks are key prerequisites for efficient loading/unloading. Whether in port container transshipment, mine ore handling, or manufacturing raw material transportation, traditional solutions relying on manual observation or simple sensors often face challenges, such as “difficulty measuring stacked cargo positions,” “untracked dynamic displacement,” and “conflicts during multi-robot collaborative operations.” These issues lead to low loading/unloading efficiency, high cargo damage, and even safety accidents.
To address this pain point, the “LiDAR Measurement System Precisely Identifies Truck Cargo Position and Real-Time Locates XYZ” solution ,integrates high-precision LiDAR with intelligent algorithms. It captures real-time 3D coordinates (X/Y/Z axes) and distribution status of cargo inside truck compartments, providing automated equipment like robotic arms and forklifts with a “centimeter-level navigation map.” This helps enterprises transition from “rough estimation” to “precise intelligent control.”

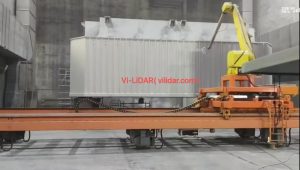
image2: loaded truck enter LiDAR scanning measurement area
I. Why Automated Loading/Unloading Require ‘Precise Identification + Real-Time XYZ Positioning’ ?
Analyzing the two images (as shown in image 1 : LiDAR point cloud diagram; Image 2: real truck cargo physical image reveals the limitations of traditional approaches:
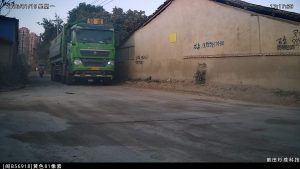
- Difficulty Perceiving Cargo Positions: As shown in Image 2, the neatly stacked wooden crates in the truck compartment may appear orderly, but often experience slight shifts (e.g., misalignment due to transport bumps) or inconsistent stacking heights. Manual observation or conventional sensors struggle to accurately determine the exact location of each cargo item (especially obscured parts), while automated equipment following preset fixed paths is prone to failed pickups or cargo collisions. The point cloud diagram in image1 intuitively demonstrates how the LiDAR “sees through” the compartment, clearly presenting cargo contours and spatial distribution.
- Untracked Dynamic Displacement: During loading/unloading, cargo may shift due to robotic arm actions or vehicle vibrations. Without real-time position updates, subsequent operations rely on repeated manual recalibration, significantly reducing efficiency.
- Conflicts in Multi-Equipment Collaboration: When multiple industrial robots (e.g., potential operational areas near the truck in Image 2) work simultaneously, the lack of a unified cargo position coordinate reference can lead to issues like “competing for the same area” or “re-picking empty spots,” even risking equipment collisions.
_________________________________________________________________________________________

image 3 : loaded truck enter LiDAR scanning measurement area
II. Vi-LiDAR Tech: Millimeter XYZ Positioning via LiDAR & AI
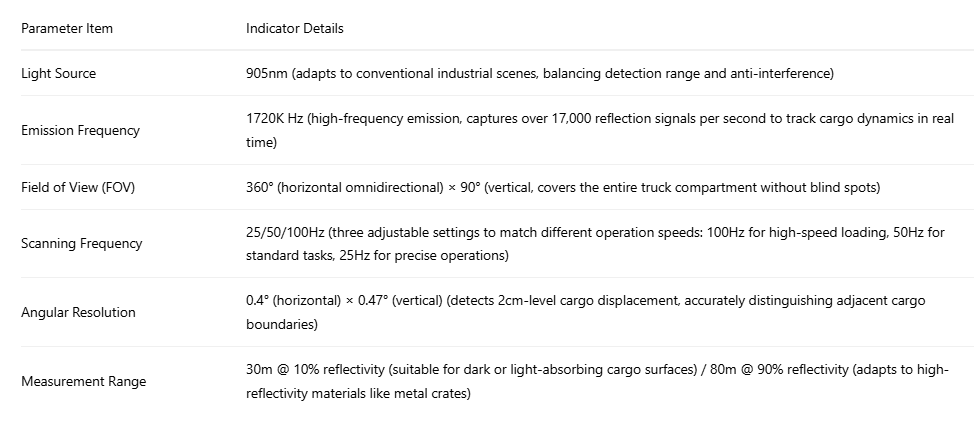
This solution centers on a high-precision laser radar sensor (with the following parameters) combined with the “AI Platform” intelligent analysis system, forming a closed loop of “sensing → computation → output” to resolve these challenges.
Vi-LiDAR LiDAR Sensors Hardware Parameters
Hardware Layer: Lidar “Penetrates Interference, Generates Precise Point Clouds”
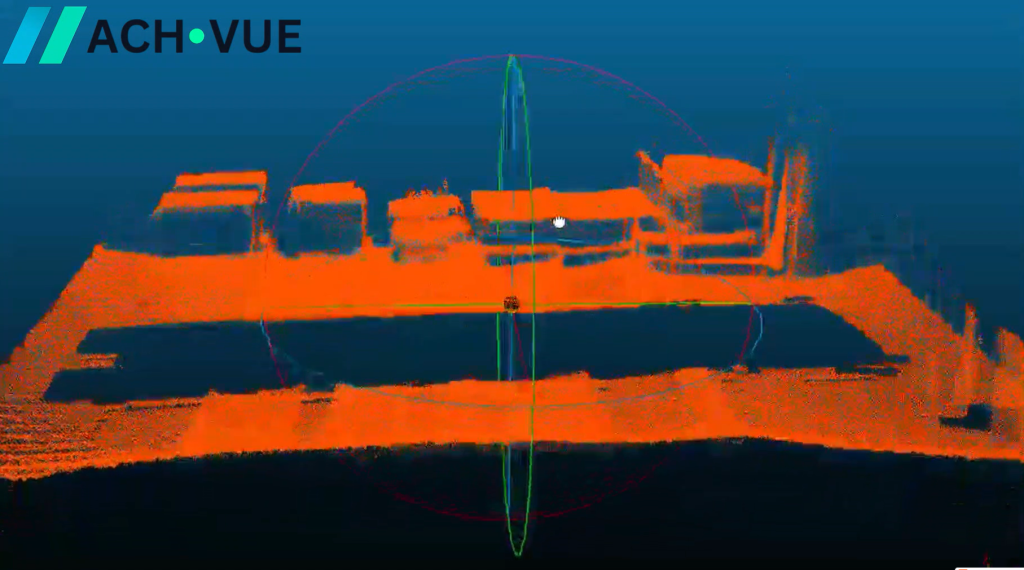
As shown in Image 1, the lidar-scanned point cloud diagram uses a blue background, with the truck body (including the cab and cargo compartment) clearly presented through orange and red point clouds. The density and morphology of the cargo-distributed point clouds reflect their actual positions and structures. These point clouds, generated by the specified-parameter lidar, accurately capture the 3D coordinates of the cargo surface.
Vi LiDAR Algorithm Layer: AI “Translates” Point Cloud Data into XYZ Coordinates and 3D Models
The raw point cloud data (e.g., the dense point cloud clusters in the video) collected by the radar requires intelligent algorithms to convert it into usable “cargo position information.” The AI Platform designs three core modules:
- Dynamic Noise Filtering: Automatically removes non-cargo reflection signals (e.g., from compartment walls or radar mounts), retaining only valid cargo surface point clouds. For example, in the video, the cargo point clouds inside the truck compartment are precisely extracted, while background interference is filtered out.
- 3D Modeling: Aggregates valid point clouds into independent contours for each cargo item (e.g., a single wooden crate), calculating its volume, stack height, and distribution within the compartment (e.g., “two wooden crates on top, other cargo below”), and generates a 3D stack model.
- Coordinate Mapping: Uses the truck compartment’s bottom-left corner as the origin (0,0,0) to establish an X (left-right), Y (front-back), Z (up-down) 3D coordinate system. Key cargo points (e.g., crate centers) are converted to standard coordinates (e.g., a top-layer crate at X=1.2m, Y=0.5m, Z=1.8m), while also outputting real-time point cloud data and volume values.
The LiDAR Measurement System can complete a single-vehicle scan in 0.8 seconds, generating a visual report with parameters like “each cargo’s coordinates, total volume, stack distribution, and center-of-gravity offset” (as shown in the video, the point cloud diagram is the visualization result, rotatable to view from different angles). This report is synced in real time to automated equipment control systems (e.g., PLCs for robotic arms or navigation modules for forklifts).
______________________________________________________________________________________________
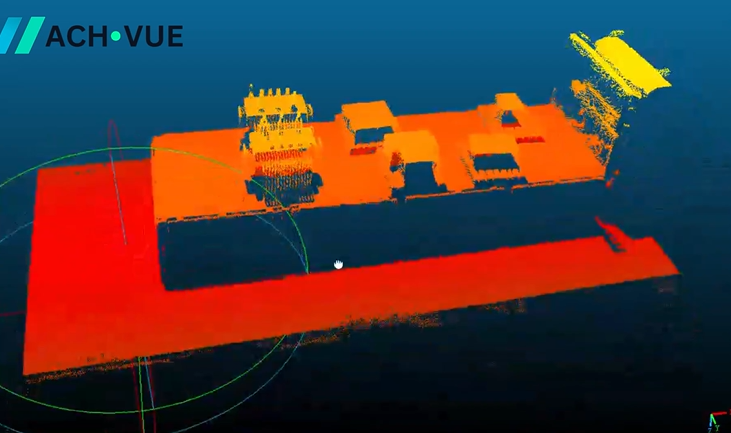
image4 : 3D point cloud model after LiDAR scanning
III. Practical Value of LiDAR Measurement System : Three Efficiency Leaps for Automated Loading/Unloading
This solution has been validated in ports, mines, and manufacturing warehouses, delivering significant improvements:
- Precise Navigation, Lowering Error RatesRobotic arms/forklifts use real-time XYZ coordinates to plan optimal pickup paths (e.g., directly targeting a crate’s center), avoiding “blind grabs” that cause drops or collisions. A port application increased cargo pickup success from 85% to 99.2%, reducing monthly losses from handling errors by ~¥150,000.
- Dynamic Adaptation, Enhancing WorkflowThe system tracks cargo displacement (e.g., after a robotic arm picks a top crate, the support beneath lower crates shifts) and adjusts subsequent operation coordinates dynamically. In Image 2, wooden crates in the compartment may slightly move during pickup, but the radar point cloud data (linked to the video model) updates coordinates in real time, ensuring accurate follow-up actions. Overall loading efficiency rose 40% (truck time reduced from 30 to 18 minutes).
- Multi-Equipment Collaboration, Preventing ConflictsA unified XYZ coordinate system allows multiple devices (e.g., 3 robotic arms + 2 AGVs) to share cargo positions. The system auto-assigns “operation priority” and “safe distances” (e.g., blocking other AGVs when a robotic arm is active). A manufacturing firm achieved zero collision incidents and a 30% boost in collaborative efficiency.
__________________________________________________________________
IV. Applicable Scenarios and Deployment
This solution adapts to the two typical scenarios in the images (video: lidar point cloud diagram showcasing technical principles; Image 2: real truck cargo physical image validating practical effects), widely used in:
- Ports/Logistics Parks: Automated loading/unloading of containerized bulk goods (e.g., bagged cement, metal parts) or full containers.
- Mines/Quarries: Rapid loading of sand, ore, and other bulk materials (identifying empty compartments for precise loader placement).
- Manufacturing Warehouses: Automated inbound/outbound of steel coils, wooden-boxed raw materials, or finished goods.
Deployment: Simply install 1–2 radar sensors at truck loading zones (e.g., the radar device in Image 1 generating point clouds, matching the specified-parameter hardware in the text). No truck modifications are needed. Connect via wired/wireless networks to control systems, with setup completed in under 1 hour.
_________________________________________________________________________
Vi LiDAR Conclusion: Giving Every Cargo a “Digital Coordinate” for Reliable Automation
From “manual estimation” to “lidar-precise XYZ positioning” (the video point cloud diagram shows the optimized positioning results), and from “blind operations” to “intelligent collaboration” (real-scene cargo recognition in Image 2), this solution leverages a 905nm high-precision laser radar and 1720K Hz high-frequency emission, combined with 360°×90° wide-angle scanning and 0.4°×0.47° ultra-high resolution, to solve the critical “cargo perception” challenge in automated logistics.
By combining the technical visualization in Image 1 (point cloud diagram) and the real-world application in Image 2 (truck cargo image), it proves reliable in complex environments. If your business faces low loading/unloading efficiency, high cargo loss, or equipment conflicts, refer to the image scenarios to see how the LiDAR Measurement System, through real-time point cloud data and 3D stack models, assigns “digital coordinates” to every cargo, making automation more precise, safer, and more efficient.